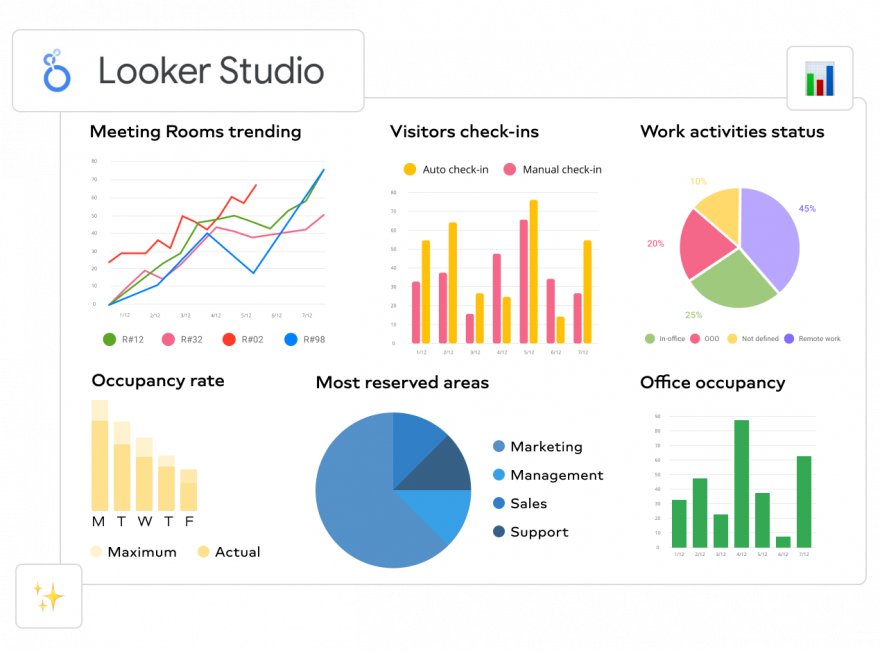
At the end of 2022, the news was announced that Google was going to unify two great products of data analysis for companies, this way Data Studio became Looker Studio and it is still a free tool with the same functions, it also has Looker Studio Pro, an improved paid version.
Now, with this information on the table, in the next post we want to help you take your first steps in Looker Studio, learn much more about the application with this quick start guide. From creating your first report, to adding data and charts to a template, to sharing files and data sources with others.
As a first step, the most important thing is to know how I can start my report. We will see that there are two main options: edit a template or create it from scratch.
When log in to Looker Studio, you will see the main web page with the Reports tab selected, and all the reports in template format to make it easier for you to create this first document or start with a blank canvas. The reports that have been shared with us will also appear and we can add our data in Looker Studio.
We must put a lot of emphasis on the upper right area, which is where we find everything we have mentioned above. Although we recommend that you use a template called ?Tutorial Report?, that It will help us create the template and teach us in a more practical way how to use the tool.
If you have a version Looker Studio Pro The interface will be very similar, so this blog post can also help you.
1. Looker Studio Templates
As we have seen previously, when starting a project we will find a tutorial template that explains how the application works and all the Looker Studio news, including new collaboration functions. We will see this template and many others by default at the beginning of the website, in the upper central area.
Other fonts are available within the template gallery such as Google Search Console, Google Ads overview or Youtube Channel Report, which can be used to complement tasks within Looker Studio. Here it is recommended, before starting to collect information, connect all data sources that you need to work, since it will be easier if we have the 100% app synchronized before we get to work with editing.
Once we open Looker Studio on our computer, we can access a new template page where they'll be avalaible all the templates that the tool offers us by default, since if we try to search for a template outside of Google, it will be quite difficult and insecure for us against malware or viruses that may enter our database. In any case, depending on the needs of each company, it is possible create templates own so that the presentation and final work is as professional, personal and complete as possible.
2. Connect a data source
For connect to your data in Looker Studio you need two components: the connectors, which link Looker Studio with your underlying information; and the data sources, which are the result of this connection, what is created. That is, data sources use connectors to extract information from a specific platform or product.
When you create a report in Looker Studio, can add a data source that you already have or create a new one to add it. Although it may seem complicated, it is an easy and intuitive task to perform.
So, to connect a data source we must:
At the top left, click Create and then select Report.
The page will appear Add data to the report, which contains two tabs:
- TO. Connect to data allows you to create a data source from scratch.
- b. My data sources allows you to add a data source that you already have.
Once you choose between create a data source from scratch or add one already created, you already have much of the work done. It is important to note that when we have this step activated the first time, it will not be necessary to log in every time we enter the Looker Studio page. Simply by going to Data source In the upper central area, we can see and edit the information as many times as necessary.
3. Choose metrics
There are different types of metrics in Looker Studio: the optional, which allow users to choose which metrics to display in charts and tables; and those of comparison, which compare the data in each row with the total and cumulative values in the charts.
To choose between one of them, we can do it from a template on the data source we want and edit it from there or if we already have a report created, we can directly edit it.
 3.1 How to add optional metrics
- Edit the report.
- Select or add a chart.
- On the right, in the properties panel, select the tab SETTING.
- Under Metrics, active Optional metrics.
- Click +Add metric or drag the metric from the panel Available fields.
 3.2 How to add comparison metrics to a chart
- We click on Edit the report.
- We select the graphic that we like.
- On the right, we will see the properties panel.
- We select the metric and a pencil icon will appear to edit it.
- We click on the menu Comparison calculation and select the combination you want.
4. How to edit a report in Looker Studio?
For edit a report, it won't take us more than 4 or 5 steps, and as always Google It makes our job easier by having a fairly intuitive tool.
We log in to Looker Studio
We look for the report that interests us, and only by clicking on the name or image it will open.
In the upper right corner, it will appear ?Edit?
Then it will be our turn add charts, metrics and all the content What we are interested in changing or adding:
- Add charts to a report
- Add fields to a chart
- Replacing fields in a chart
- Remove fields from a chart
- Snap to Grid
- Change chart type
- Edit chart properties
- Add other components to a report
5. Adding report filters
Filters are used to reduce the data shown to report readers, highlighting what is most important. It is possible to apply filters to:
5.1 How to add filters to a chart
- We open the report to edit.
- We select the graphics that we are interested in filtering, we can also Filter a group of charts or controls.
- In the properties panel, select the tab Setting.
- We click +Add a filter.
- Then, Create filter and we assign it a name so we can save it.
- Include or Exclude, include filters only include data that matches the expression you provide. Exclude filters remove all data that matches the expression.
- We select the graph or metric that we are interested in filtering.
- We select the comparison operator (is equal to, contains, greater than... etc.)
- We indicate a comparison value for the expression.
- AND WE SAVE!
5.2 How to add filters to an entire report or a page
To add filters to an entire report, from the menus, select File > Report Settings.
To add filters to a page, from the menus, select Page > Current Page Settings.
Next:
- In the properties panel on the right, click +Add a filter.
- Set up the filter following the instructions above.
Edit filters
- Edit your report.
- Select the chart or control that has the filter. You can also use the page setup menus or filter themes described above.
- In the properties panel, select the tab Setting.
- Click Edit.
6. How to Share Reports in Looker Studio?
You can share your reports with other users by sending them an email invitation to visit Looker Studio. You can also add specific users or Google groups, and share items more broadly without needing to be a Google Workspace user.
6.1 How to share a report
- Sign in to Looker Studio.
- View or edit the report you want to share.
- At the top right, click Share. The dialog box will appear Share with others.
You can also do this directly from the Reports page. To do this, find the report you want to share and, on the right, click Further. Then click Share.
6.2 Share with specific users and groups
- Open the dialog Share with others.
- In Add users, enter the names or email addresses of the users you want to share with. You can also share it with Google Groups.
- Select the access permission you want to give to the users and groups you have specified:
- You can edit: Users can edit the resource and share it with other users.
- Can see: Users can view the resource, but they cannot edit it or share it with other users.
- To assign different permissions to different users, click Manage access.
- By default, the users you invite receive an email with a link to the item you shared with them. Uncheck Notify users so that email is not sent.
- Click Send.
6.3 Share with specific users and groups
To share your reports with other people, they must have a Google account. If you want to share reports with non-Google accounts, you have several options:
- Ask the person you want to share the report with if they have a Google account you can share the content with. Could be:
- A personal account ending in @gmail.com.
- A work or school account that the user uses to use Google products such as Gmail, Drive, Docs, Sheets or Slides.
- If the user you want to share the report with doesn't have a Google account, they'll need to sign up for one. You can do it in https://accounts.google.com/signupwithoutgmail.
- Use another method to share: you can share via link or send a PDF file by email.


